
TL;DR
A strong design system case study is not a gallery of polished components. It connects a product problem to design decisions, team contributions, rollout, adoption, and credible outcomes. We recommend using a focused set of artifacts, labeling evidence honestly, and showing the exceptions and tradeoffs that made the system work.
What makes a strong design system case study?
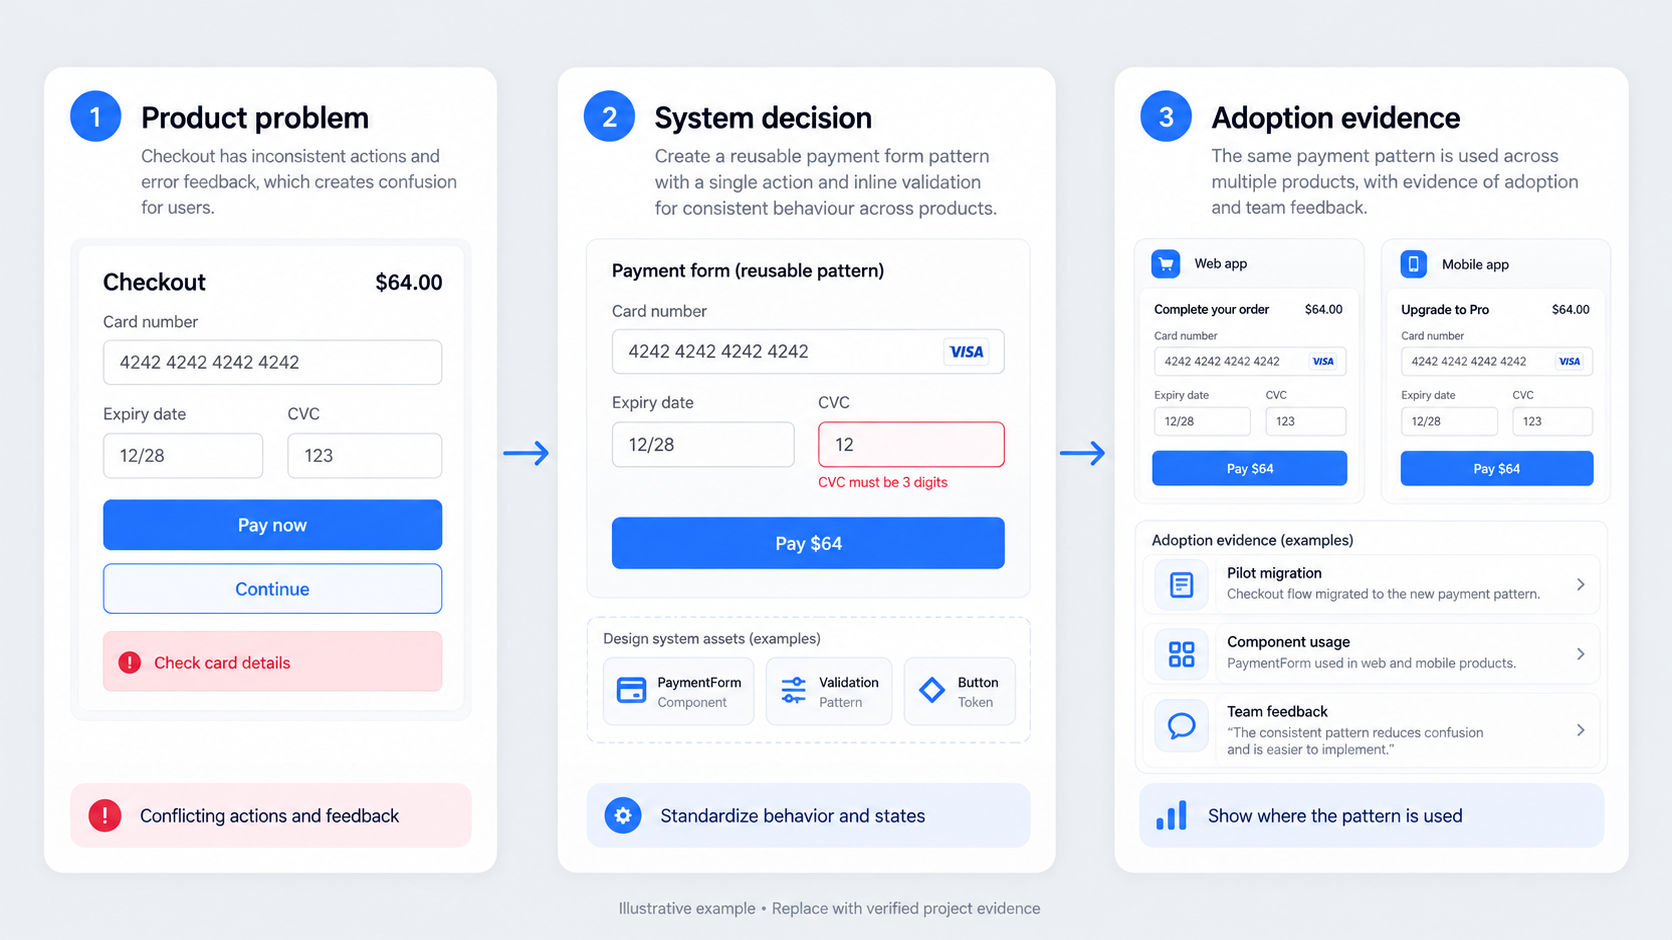 The best case studies focus less on the library itself and more on the decisions, collaboration, adoption, and product outcomes it supported.
A large component library proves output, not impact. It has limited value if teams ignore it, recreate variants, or cannot choose the right pattern for a product scenario.
A persuasive case study follows a clear sequence: context, baseline, constraints, decisions, artifacts, rollout, adoption, and outcomes.
Lead with the product problem, not the library
State who experienced the problem, where it appeared, and why it mattered. Instead of “we created a new button system,” explain that designers, engineers, or customers encountered conflicting actions and error behaviour during checkout.
Use one representative workflow to make the issue concrete. Show the inconsistency, explain the resulting risk, and demonstrate how standardisation resolved key decisions while preserving justified exceptions.
Adoption beats component count
Usage, trust, reuse, and contribution are stronger signals than library size. In our view, a smaller system used consistently is healthier than a large library that teams routinely detach or override.
Variant reduction can also be a deliberate outcome. Removing unsupported options makes accessibility reviews, maintenance, implementation, and product decisions easier to manage.
Use a macro-to-micro case study structure
Open with a concise summary covering your role, team, scope, product context, constraints, and strongest evidence. Then move from the organisational problem to a representative workflow, the system decisions behind it, and proof of adoption.
This structure connects detailed documentation to the larger problem the system was intended to solve. It also prevents readers from getting lost in component-level detail.
Context, baseline, and constraints
Describe the starting environment before presenting solutions. Relevant evidence might include fragmented design files, duplicated code, inconsistent workflows, or known accessibility gaps.
Name the constraints that shaped the work, such as:
- Legacy code or platform differences
- Release pressure
- Accessibility debt
- Limited research access
- Incomplete instrumentation
- Distributed ownership
- Components that could not be replaced immediately
Constraints are not apologies. They explain why the final system took a particular form.
Decisions, rollout, adoption, and outcomes
For each major decision, explain the problem, options considered, chosen direction, and tradeoff. Then follow it into implementation through pilots, migration, documentation, contribution, and maintenance.
Close the loop with real usage. Show what teams adopted, where exceptions emerged, what changed after feedback, and which outcomes can reasonably be connected to the system. Avoid presenting the system as the sole cause of wider business results.
Choose artifacts that prove decisions—not everything in Figma
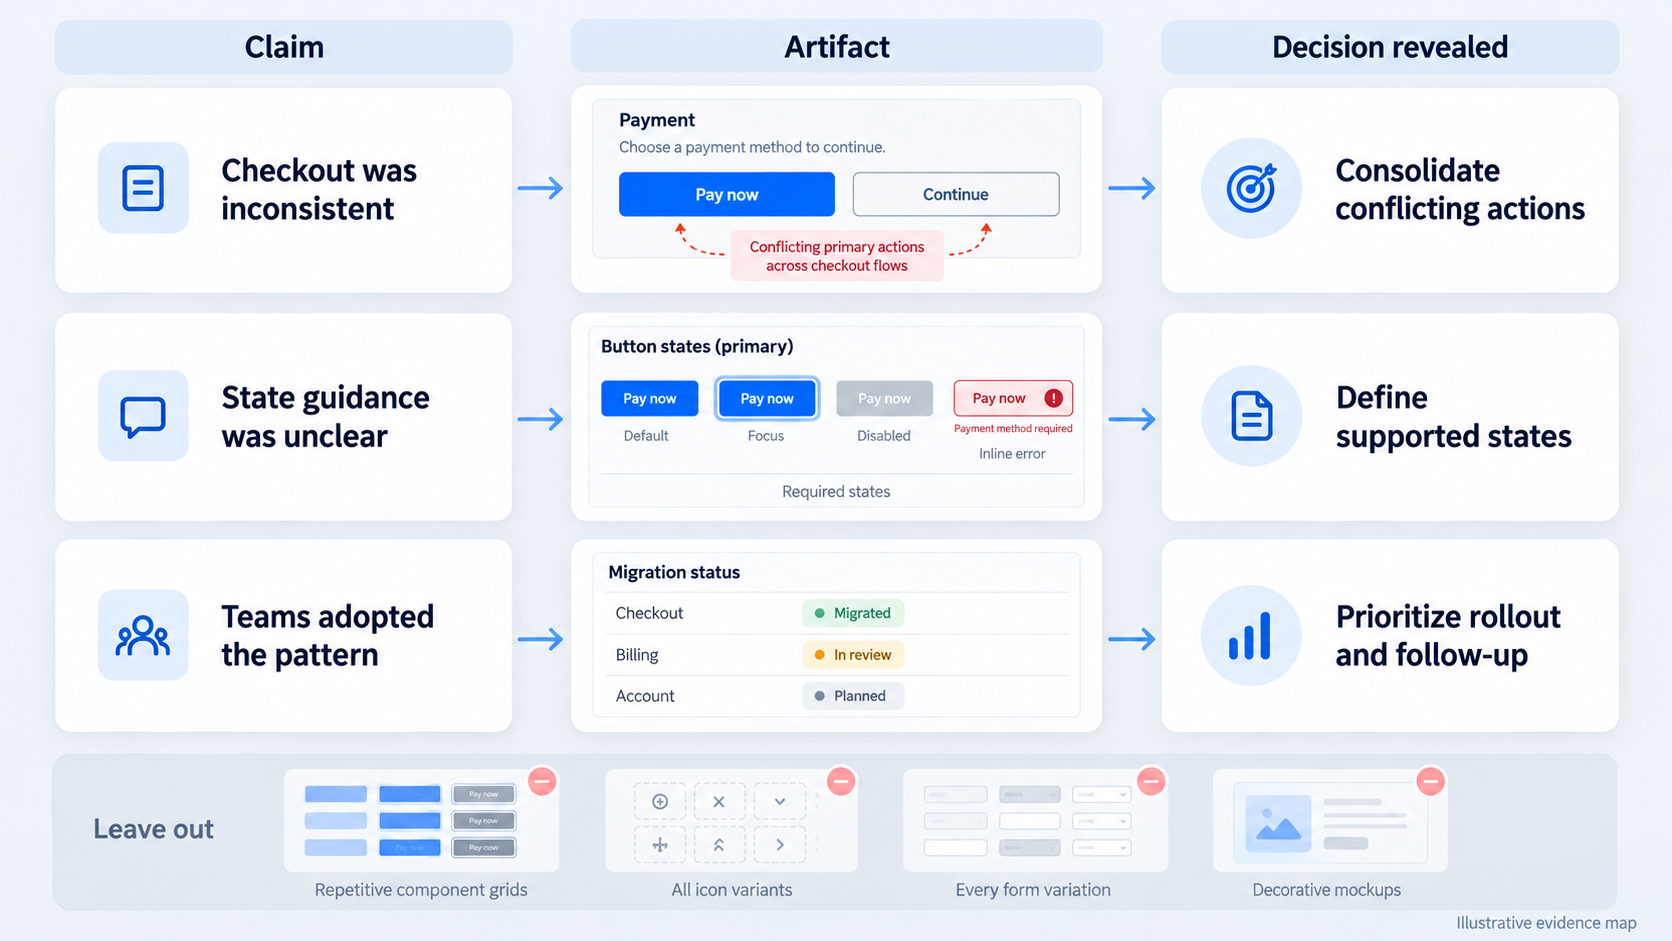 Include an artifact only when it proves a problem, decision, tradeoff, contribution, adoption behaviour, or outcome. This filter keeps the case study from becoming an exhausting file tour.
A simple claim-to-evidence map can help:
| Claim | Artifact | Decision revealed |
|---|---|---|
| Checkout behaviour was inconsistent | Annotated before screen | Conflicting actions needed consolidation |
| Teams needed clearer state guidance | State matrix | Required and unsupported states |
| Adoption improved | Usage or migration record | Rollout priorities supported uptake |
Cut repetitive grids, exhaustive token tables, decorative mockups, and screenshots that require a live explanation. Our guide to Figma design system examples and what strong libraries get right offers more criteria for assessing library structure.
A practical artifact selection scorecard
Assess each artifact for:
- Relevance: Does it support the central problem?
- Decision value: Does it reveal judgment?
- Evidentiary strength: Does it substantiate a claim?
- Uniqueness: Does it add new information?
- Audience fit: Will the intended reader understand its value?
Keep the smallest set that supports the narrative. Captions should explain what changed, why it changed, who influenced the decision, and what evidence followed.
Original before-and-after UI examples
Compare screens using the same content, conditions, and viewport assumptions. Otherwise, the apparent improvement may come from a simpler scenario rather than the system.
Annotate meaningful changes in spacing, typography, tokens, interaction states, responsive behaviour, and accessibility requirements. The strongest example is not merely prettier; it is more predictable and practical to implement.
Present the system from foundations to product patterns
Present foundations, components, patterns, states, accessibility guidance, code, and documentation as connected layers. The system’s schema lies in the relationships between those layers, not just its folder structure.
One product scenario can demonstrate those relationships. A checkout error might connect colour and spacing tokens to fields, alerts, validation rules, content guidance, and responsive behaviour.
Foundations and components
Show only the foundations needed to explain consequential decisions. If semantic colour tokens supported accessible error states across themes, illustrate that relationship rather than listing every colour value.
Useful evidence may include token naming, state coverage, variant reduction, design-to-code mapping, deprecated options, and contribution rules. Flexibility is not automatically a sign of maturity; fewer variants may produce clearer decisions and more reliable testing.
Patterns, accessibility, and documentation
Components gain meaning inside workflows. Show how they behave across loading, error, empty, success, permission, and responsive states.
We treat documentation and accessibility as system behaviour, not appendices. Documentation should tell teams when to use a pattern, when not to use it, which states are required, and how exceptions are reviewed.
Show your contribution without erasing the team
Design systems are collaborative. Separate individual work from team ownership and stakeholder approval with precise verbs such as led, proposed, facilitated, designed, tested, documented, implemented, reviewed, and approved.
Avoid saying one person “created the system” when engineering, accessibility, product, and design partners shaped it. Explain decision rights and contribution paths instead.
Use an attribution matrix
A compact matrix clarifies ownership:
| Workstream | Attribution example |
|---|---|
| Research | I led interviews; the team synthesised findings |
| Foundations | I proposed tokens; system owners approved them |
| Components | I designed states; engineering implemented them |
| Rollout | The team owned migration; I facilitated onboarding |
Pair each label with an action and deliverable. “Contributed to governance” is vague; “facilitated proposal reviews and documented decision criteria” is defensible.
Include disagreement and tradeoffs
Show rejected approaches, disputed variants, and competing priorities. Explain the evidence used and who held approval authority.
A failed approach can reveal more judgment than a polished library. It shows how governance handled change rather than implying the system appeared fully formed.
Measure outcomes when the baseline is incomplete
Useful measures include design cycle time, component reuse, interface defects, accessibility coverage, team adoption, and engineering rework.
Do not invent before-and-after figures. Business-value discussions increasingly frame design systems around product and operational priorities rather than component volume alone, but each case study still needs evidence appropriate to its own context.
Build an evidence ladder
Use the strongest available evidence and label its limits:
- Direct measures: Instrumented usage, defects, cycle time, or coverage.
- Operational proxies: Detachments, duplicated components, migration progress, or review changes.
- Structured qualitative evidence: Recurring interview or support themes.
- Observations: Directional findings requiring further measurement.
- Hypotheses: Expected benefits that remain unvalidated.
Record the period, sample, definition, and limitations behind each claim. “Reuse increased across the pilot files reviewed” is more credible than an unsupported claim of organisation-wide adoption.
Report qualitative evidence responsibly
Synthesize recurring themes from interviews, engineering feedback, support reports, design reviews, and workflow observations. Look for patterns rather than relying on memorable anecdotes.
Qualitative evidence can explain why adoption changed or where friction remains. It should not be converted into financial returns without a defensible baseline and calculation.
Document rollout, adoption, and the messy reality
Rollout is part of the design problem. Publishing a library is only one step; teams must understand, use, trust, and improve it.
Show migration priorities, documentation gaps, resistance, contribution workflows, legacy constraints, and exceptions. These details demonstrate operational judgment that polished screenshots cannot.
From launch to sustained adoption
Document pilot selection, migration order, onboarding, contribution reviews, release communication, deprecation policies, and feedback-driven changes.
Smashing Magazine’s case study on design system artifacts describes how supporting materials and organisational practices shape system work. Following that principle, we recommend including the artifacts that changed behaviour, not only interface assets.
Exceptions are evidence
An exception may expose a missing reusable pattern or a genuine one-off need. Explain how the team distinguished between the two.
Record whether unsupported variants were rejected, escalated, temporarily accepted, or incorporated. That history shows governance operating in practice.
Evaluate an AI-first design system with real UI scenarios
AI generation can test system clarity, but it does not prove compliance. A polished screen may invent variants, misuse tokens, omit accessibility requirements, or fail under edge cases.
Our guide to producing AI UI that is actually shippable explains why visual plausibility is only a starting point. Structured system data may help AI tools access tokens and documentation, but contextual decisions still require human review.
A repeatable UXMagic evaluation workflow
We recommend a “describe, design & assess” workflow:
- Define the user goal, platform, constraints, required states, and accessibility expectations.
- Use an AI UI generator for Figma-ready designs to produce alternative directions.
- Compare each direction with documented system rules.
- Record invented variants, missing states, and edge-case failures.
- Refine the strongest option and retain rejected outputs as decision evidence.
- Use an AI-to-Figma conversion workflow to move selected work into an editable review environment.
This turns generation into evidence by showing how the team assessed and corrected the output.
AI compliance scorecard
Evaluate generated directions against semantic token use, approved components, product patterns, required states, responsive behaviour, content expansion, accessibility, and implementation feasibility.
An AI design assistant workflow for shippable UI should expose these criteria rather than reward polish alone. Enterprise teams should also assess security, privacy, governance, and scalability before bringing generated interfaces into production workflows.
Adapt the case study for portfolios and business stakeholders
Build one evidence base, then adjust the emphasis for each audience. Hiring reviewers need role clarity; design peers need system logic; engineers need feasibility; product leaders need adoption and risk; executives need operational outcomes.
Portfolio version
Open with role, team, scope, constraints, and one credible result. Use a representative product problem to demonstrate decisions, craft, collaboration, contribution boundaries, and learning.
Protect confidential information through permission, aggregation, or careful generalisation. Never replace unavailable evidence with fabricated metrics.
Internal or executive version
Connect adoption evidence to delivery risk, accessibility, quality, rework, and customer experience. Keep technical detail available, but do not lead with token architecture.
End with current limitations, governance needs, unresolved exceptions, and the next measurement plan. Transparency creates a stronger business case than inflated claims.
Final case study checklist
Before publishing, confirm that:
- Every artifact supports a claim.
- Every outcome has an evidence label.
- The opening names the product problem.
- Constraints and tradeoffs are visible.
- Individual and team contributions are separated.
- Adoption is measured beyond publication.
- Exceptions or failed approaches are included.
- Causality is not overstated.
- Confidential information is handled responsibly.
- The case study shows what changed, not just what was made.
Describe, design & prove the system
Use UXMagic to generate realistic interface directions, assess them against explicit design system rules, and turn the strongest decisions into editable Figma-ready evidence. Start building a case study that proves how your system performs under real product conditions.